VT Sports Solutions · Research Suite
The opponent, read snap by snap.
The Matchup Brief is a custom scouting package built on our own play-by-play engine — one that reads every play of every game and computes metrics the box score never gives you. Pick the matchup. Get back a coach-ready dossier on both teams, with every number traced to its source.
The problem
Box-score stats stop where the game gets interesting.
Public stat sites give you season averages and a leaderboard. They can't tell you when a team scores, which situations break them, or what the explosive plays actually looked like. That context is where games are won — and it's exactly what gets left on the cutting-room floor.
Flat
Totals and per-game averages with no situational shape — no clutch windows, no red-zone behavior, no trend.
Generic
The same handful of categories everyone else has. Nothing built for how a staff actually scouts an opponent.
Unverifiable
A number with no trail back to the plays that produced it. You either trust it or you don't.
The engine
A custom play-by-play engine — not a stats subscription.
We built our own parser that takes raw play-by-play and reconstructs the entire game: every down and distance, field position, player, clock, and outcome. Because we own the engine, we can design any metric we want — and re-cut the same season a dozen different ways without waiting on anyone's feed.
Reads the play, not a label
Play-level parsing
Each play description is decoded into yards, type, spot, down & distance and player — kneel-downs, no-plays and penalties filtered out so you're seeing true scrimmage football.
Possession reconstructed
Drive logic
The engine rebuilds drives from the play stream — so three-and-outs, scoring drives and field-position swings are measured, not guessed.
Design our own
Bespoke metrics
Want a stat that doesn't exist anywhere — a specific window, a custom split, a situational rate? If it's in the plays, we can build it.
What it measures that nobody else does
Advanced metrics, built into every brief.
A sample of what the engine computes on both teams — each one available full-season and as a last-3-games trend, so you read form, not just averages.
Middle 8 Bespoke window
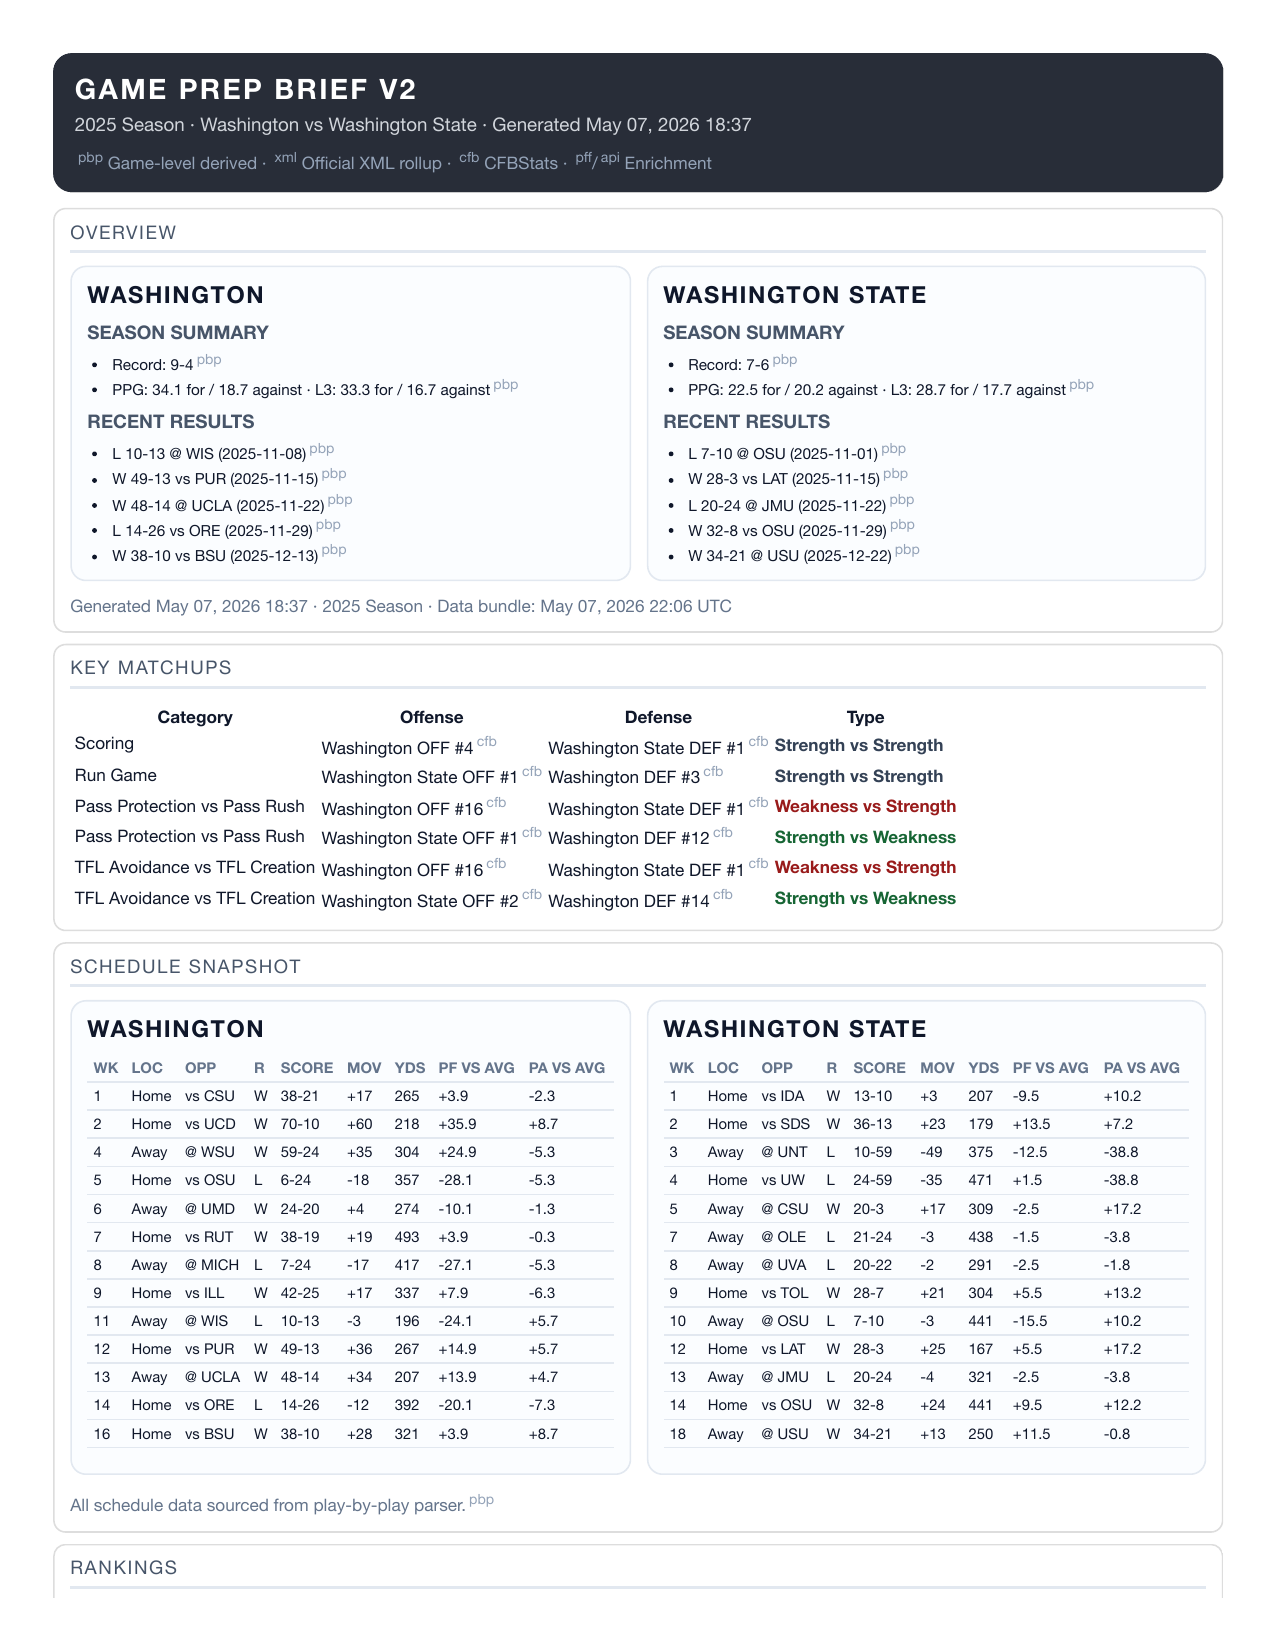
Scoring in the final 4 minutes of the 2nd quarter and first 3 of the 3rd — the momentum swing coaches obsess over, measured as a margin with the actual scoring plays attached.
Explosive plays Dual-source
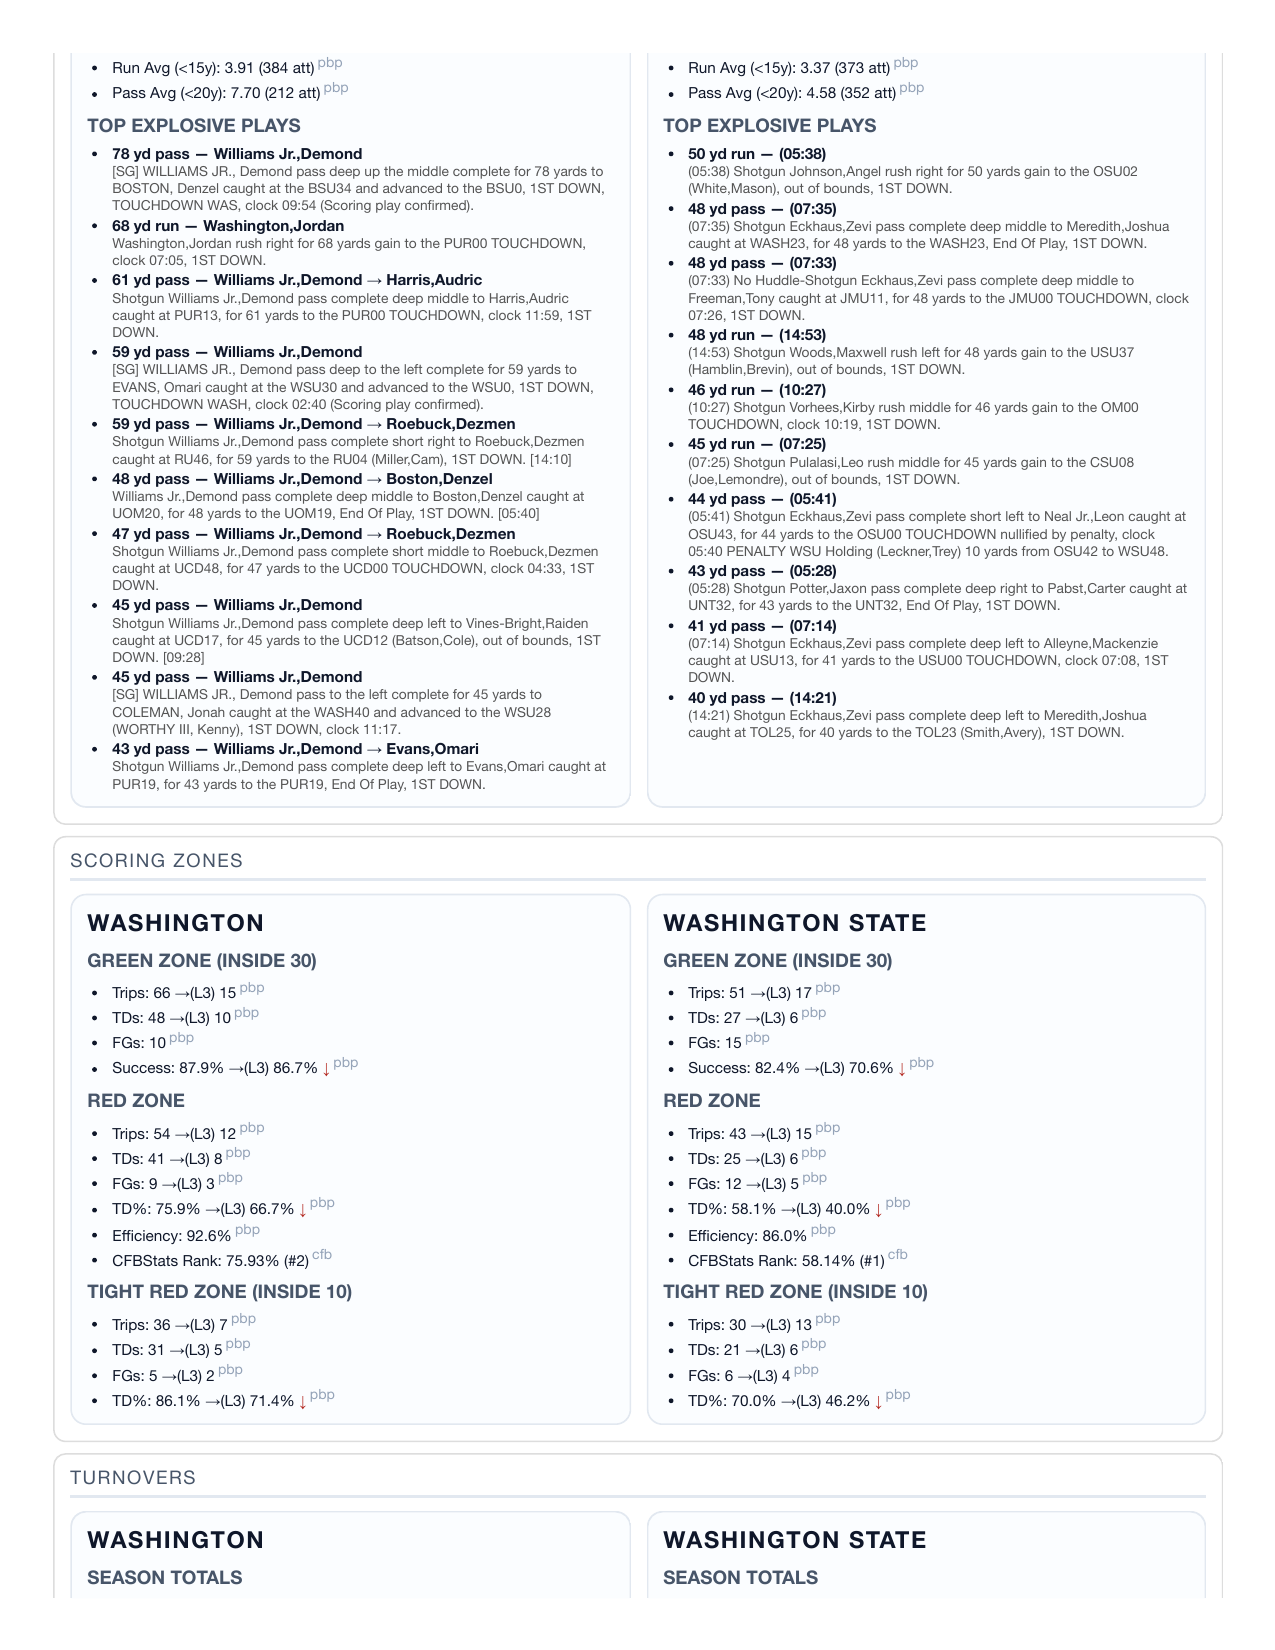
Explosive runs and passes counted at the play level and cross-checked against the official 20+ definition — with the top explosives surfaced by name, yardage and clock.
Scoring zones Custom splits
Red-zone TD%, a tighter goal-line split, and our own 20-yard "green zone" success rate — kneel-down-only trips filtered out so the rate is honest.
Points off turnovers Attribution
Points actually scored off takeaways — and surrendered off your own giveaways — not just the raw turnover margin.
After-turnover sequences Drive-level
What happened on each possession following a takeaway or giveaway — drive-by-drive, with the resulting points and field position.
Trenches & pressure Enrichment
Tackles-for-loss created and allowed, sacks, negative scrimmage plays, and missed-tackle rates — the line-of-scrimmage signal under the scoreboard.
Tempo & blitz rate Enrichment
Snap pace, hurry-up rate, average play-clock remaining and defensive blitz percentage — how each team likes to control the game's rhythm.
Penalty fingerprint Behavioral
Procedural vs. live-ball, pass interference drawn vs. allowed, offensive/defensive holding, and the team's single most frequent flag — game by game.
Situational down rates Context
3rd- and 4th-down conversion with attempts shown, plays per game on both sides, and recent top targets on 3rd down and in the red zone.
Key-matchup matrix Head-to-head
Both teams ranked side by side on scoring, run game, pass protection vs. rush and TFL — flagged Strength-vs-Weakness so the leverage points jump out.
How a brief gets built
From raw plays to a coach-ready dossier.
01
Parse
Every play of the season decoded into structured detail.
02
Compute
The full suite of custom metrics, season and last-3.
03
Reconcile
Every derived number checked against the official totals.
04
Match up
Both teams overlaid into head-to-head leverage points.
05
Deliver
A clean, sectioned package ready to put in front of a staff.
The deliverable
This is what actually lands on your desk.
A real Matchup Brief — Washington vs. Washington State, 2025. Both teams, side by side, across roughly a dozen sections. Print-ready, and every figure tagged with the source it came from.
The read
Strength against strength, in numbers.
A few figures the engine pulled from that same brief — Washington's high-octane offense running straight into Washington State's top-ranked defense.
Top explosive — surfaced by the engine
78-yard pass · Demond Williams Jr. → Denzel Boston · TD
[SG] WILLIAMS JR., Demond pass deep up the middle complete for 78 yards to BOSTON, Denzel caught at the BSU34 and advanced to the BSU0, 1ST DOWN, TOUCHDOWN WAS, clock 09:54 (Scoring play confirmed).
Why you can trust it
Every number carries a receipt.
Look closely at the brief and you'll see a small tag beside each figure. That's the source. Nothing is a black box — every stat says exactly where it came from, and the four sources are reconciled against each other.
Computed by our engine, straight from the parsed play-by-play.
The official game-data feed — used to anchor and cross-check totals.
National rankings and the source-of-truth for category definitions.
Charting-grade detail — blitz rate, tempo, missed tackles and trench data.
- ✓Reconciled to the official record. Derived 3rd-down, yardage and defensive numbers matched line-by-line against the season totals.
- ✓Discrepancies disclosed, not hidden. Where definitions differ, the brief shows the delta and explains it in plain language.
- ✓Explosives shown both ways. Our play-level count and the official 20+ count side by side, so nothing is inflated.
- ✓Plays attached to insights. Top explosives and Middle-8 scores come with the verbatim play, clock and player.
Who it's for
Built for the people who actually game-plan.
Coaching staffs
A head-to-head read on the opponent with the situational windows and trench signals you actually scout — not a leaderboard.
Analysts & front offices
Custom metrics on demand. If you can describe the split, we can build it from the plays and put it in the brief.
Broadcast & media
Storylines with receipts — the Middle-8 swing, the explosive that flipped a game, the turnover that decided it, each with the play to back it.
See it on a matchup you already know cold.
The fastest way to judge the brief is to read one on a game you've already watched closely. Tell us the matchup — we'll build it.
victorres11@gmail.comCustom metrics on request · Both teams · Every number sourced
The Matchup Brief · made by VT Sports Solutions · victorres11@gmail.com